Challenge
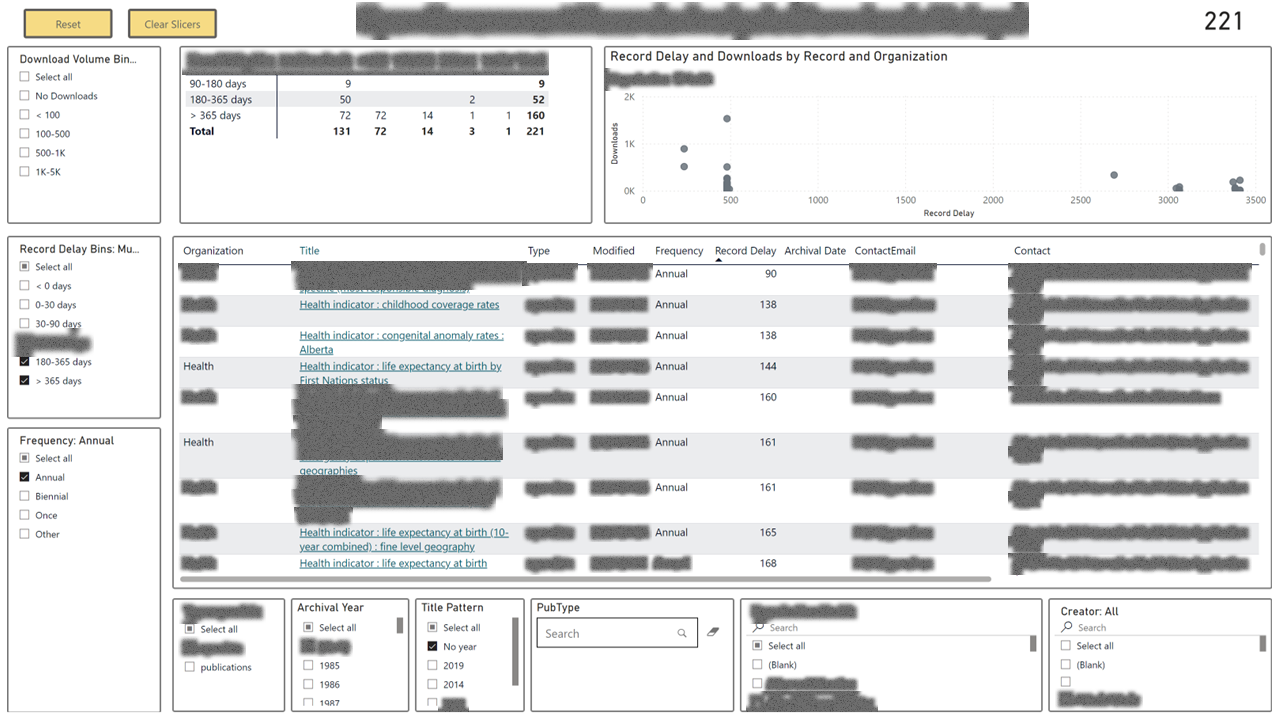
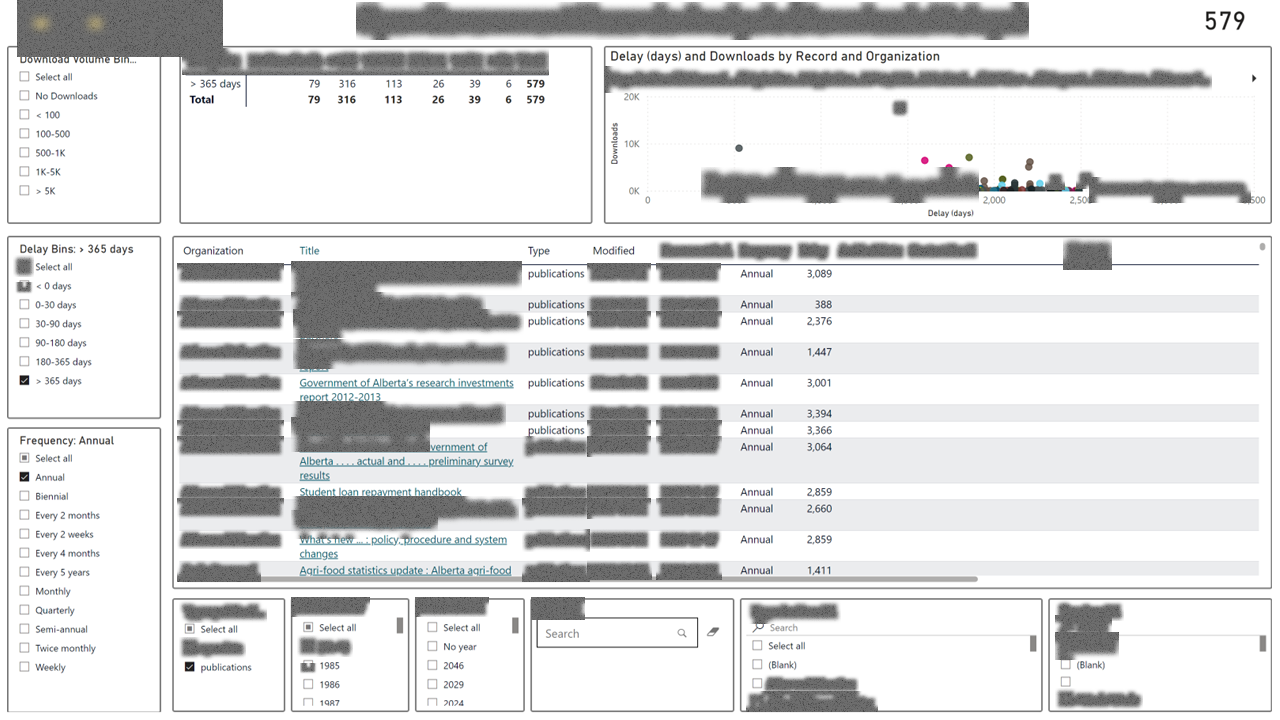
A regulated workflow that publishes content for the public was missing its target turnaround times, but no one could say where in the pipeline delays were accumulating. Existing reporting showed total volume and an average cycle time, both of which hid the distribution: most items were fast, a small tail was very slow, and the average looked acceptable.
Approach
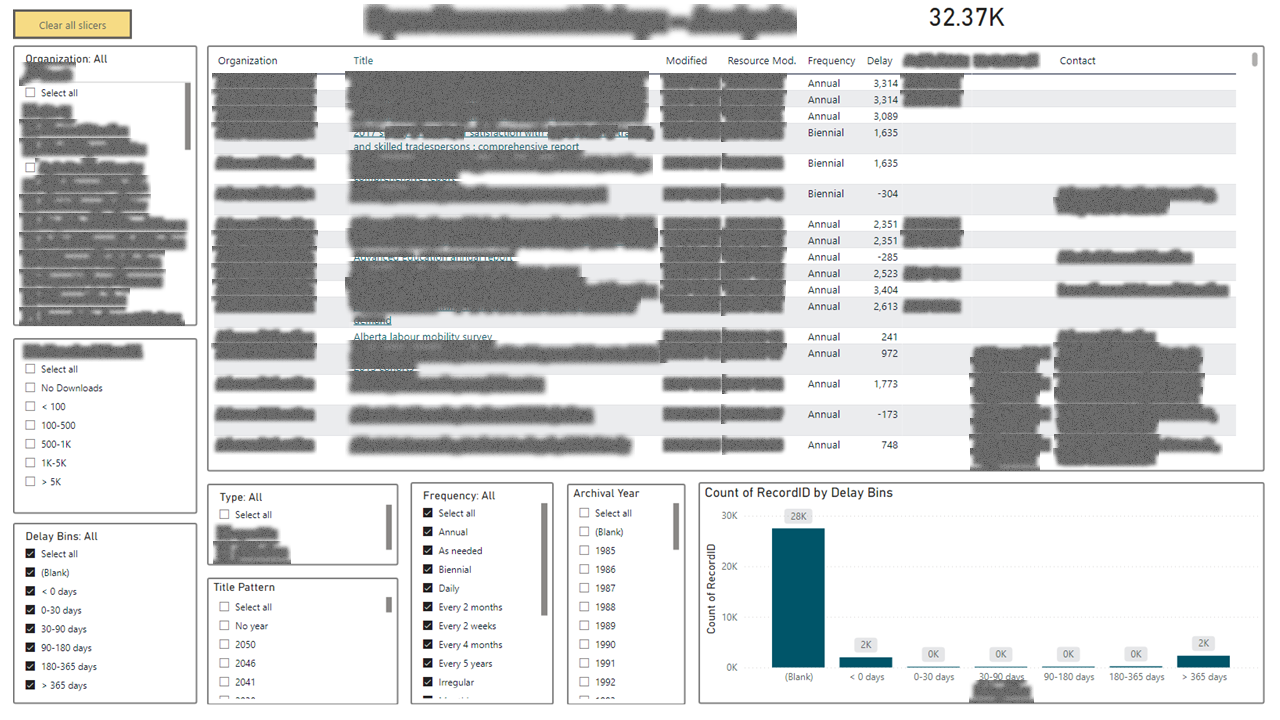
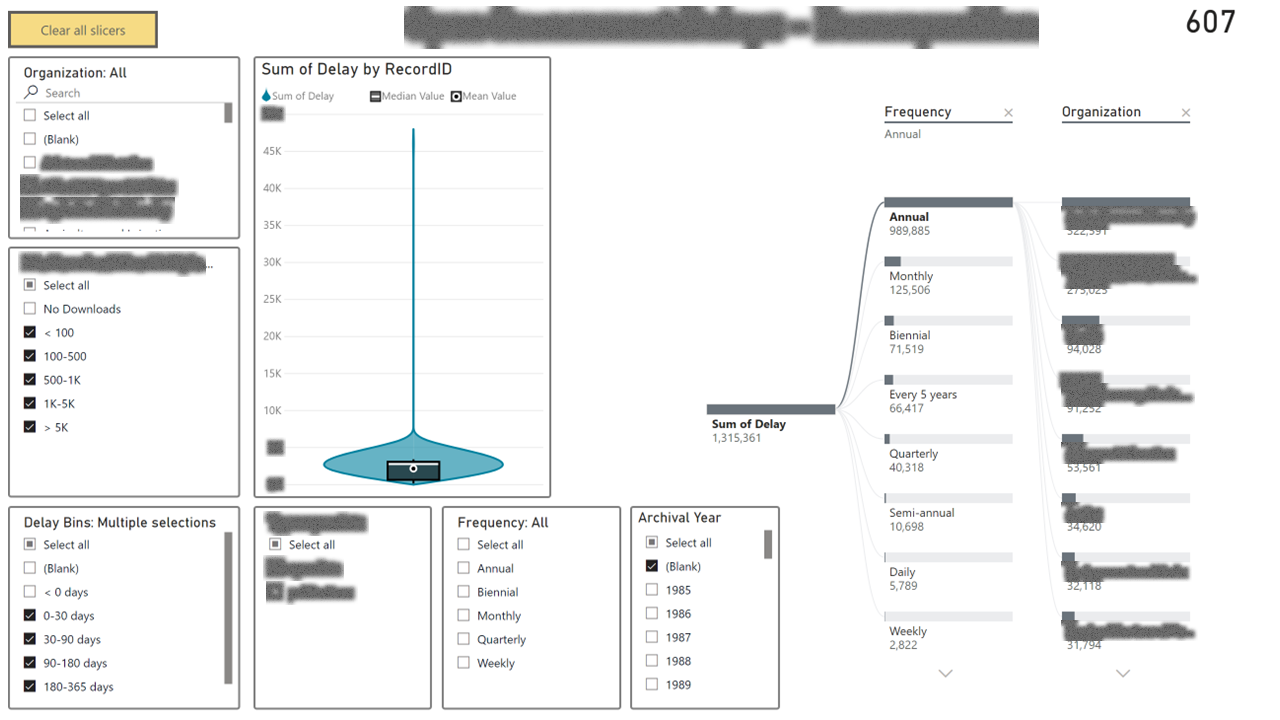
I built a diagnostic report that splits the population into "on time" and "delayed" cohorts, then breaks the delayed cohort down by content type, contributing factor, and pipeline stage. A decomposition tree lets operators interactively pull on whichever dimension is biggest to find the actual root cause rather than a proxy. Distribution charts replace averages so the long tail is visible.
Outcome
The report shifted the conversation from "we're meeting our average" to "here are the three content types responsible for 80 percent of the delays." Operations had a concrete list to work, and the same report became the artifact used to track whether interventions were moving the distribution.