Challenge
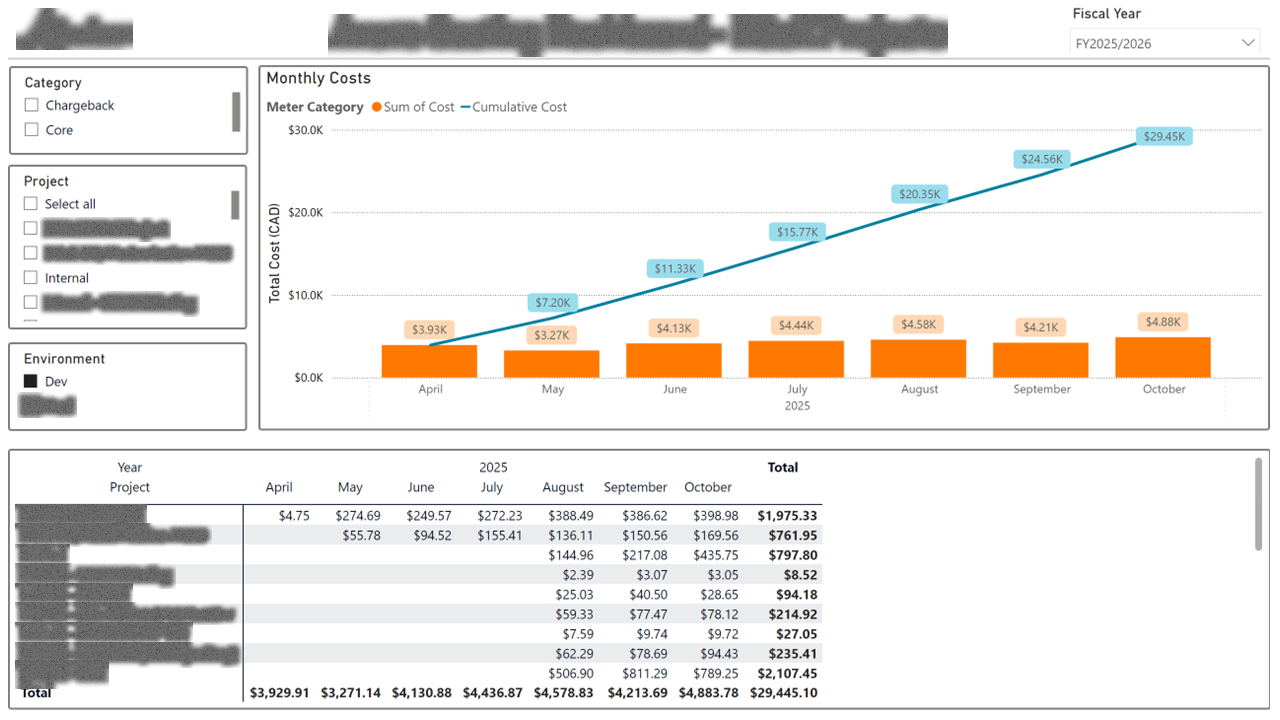
The organization's Azure spend was growing month over month, but no one could explain why. Raw cost exports were available, but they were too granular to read directly and too coarse once aggregated by subscription. Project owners couldn't see what their workload was costing, which meant optimization conversations had no data behind them.
Approach
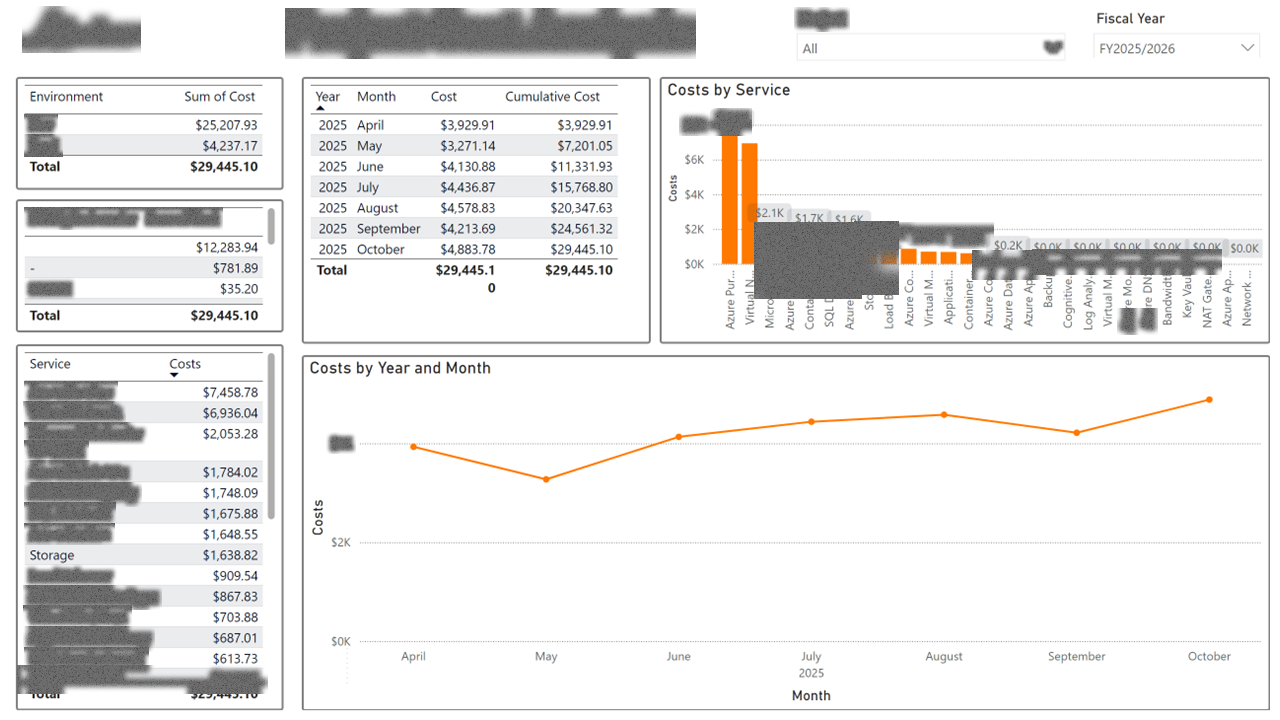
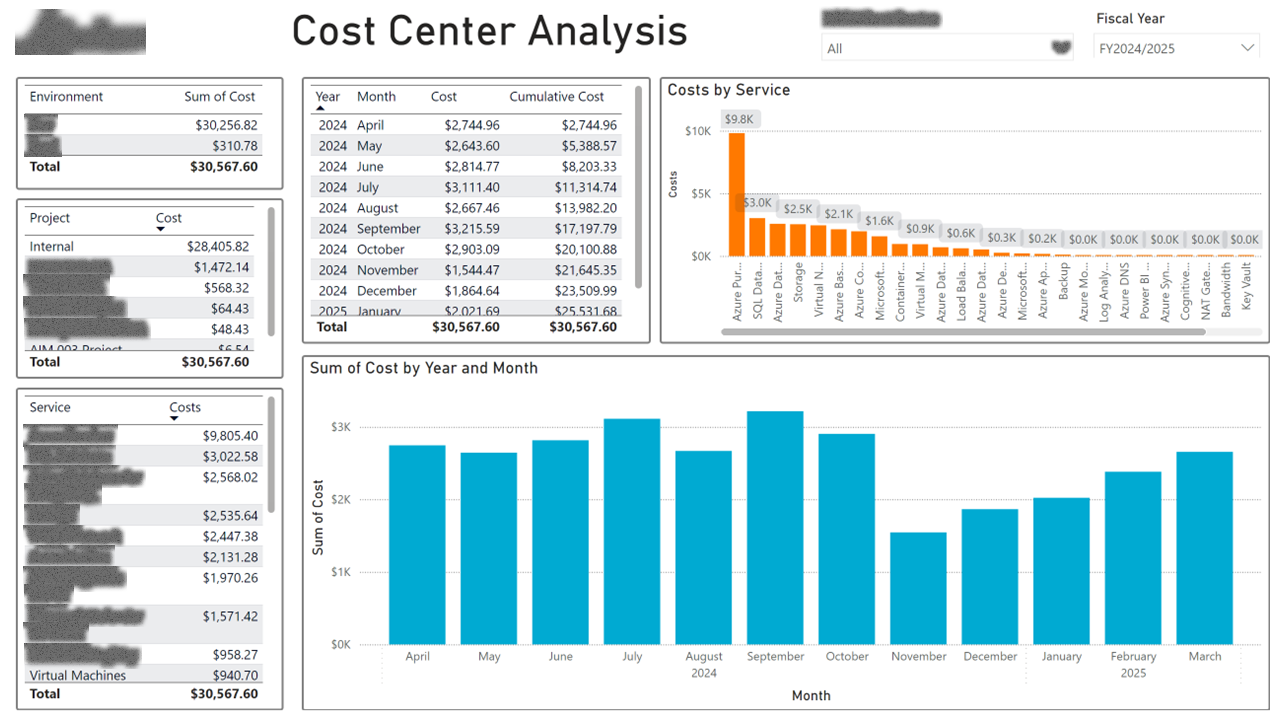
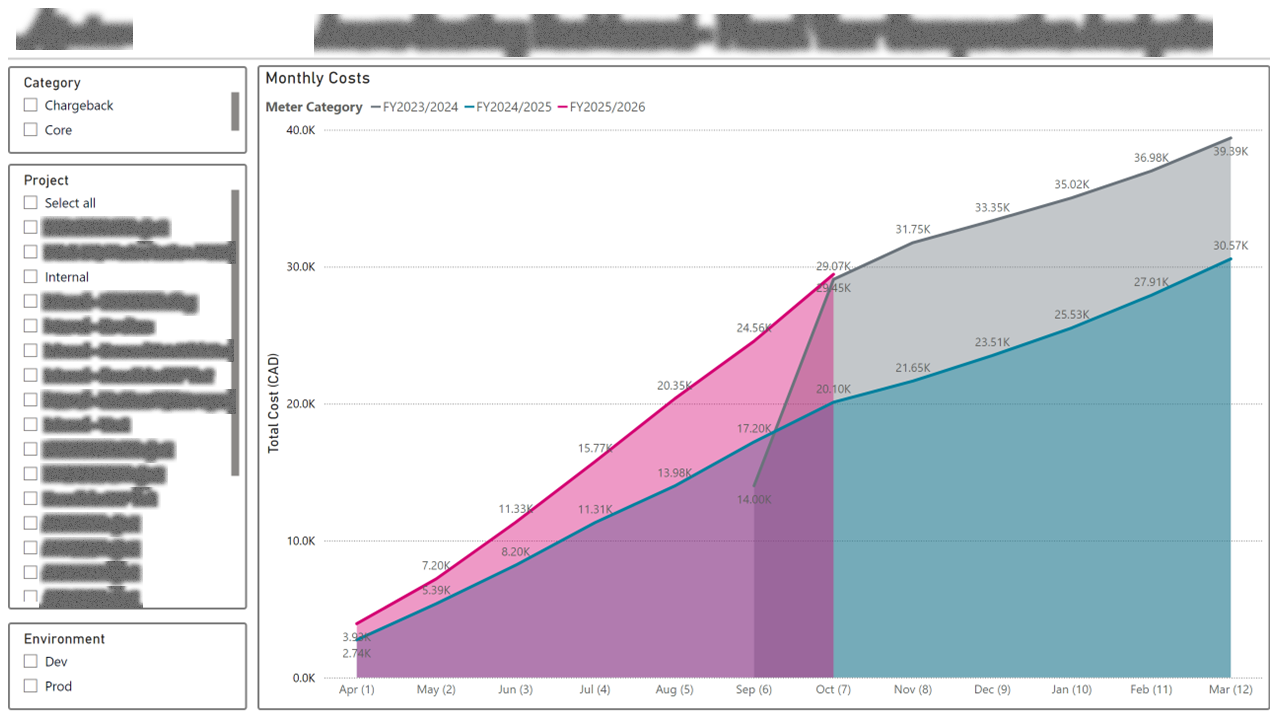
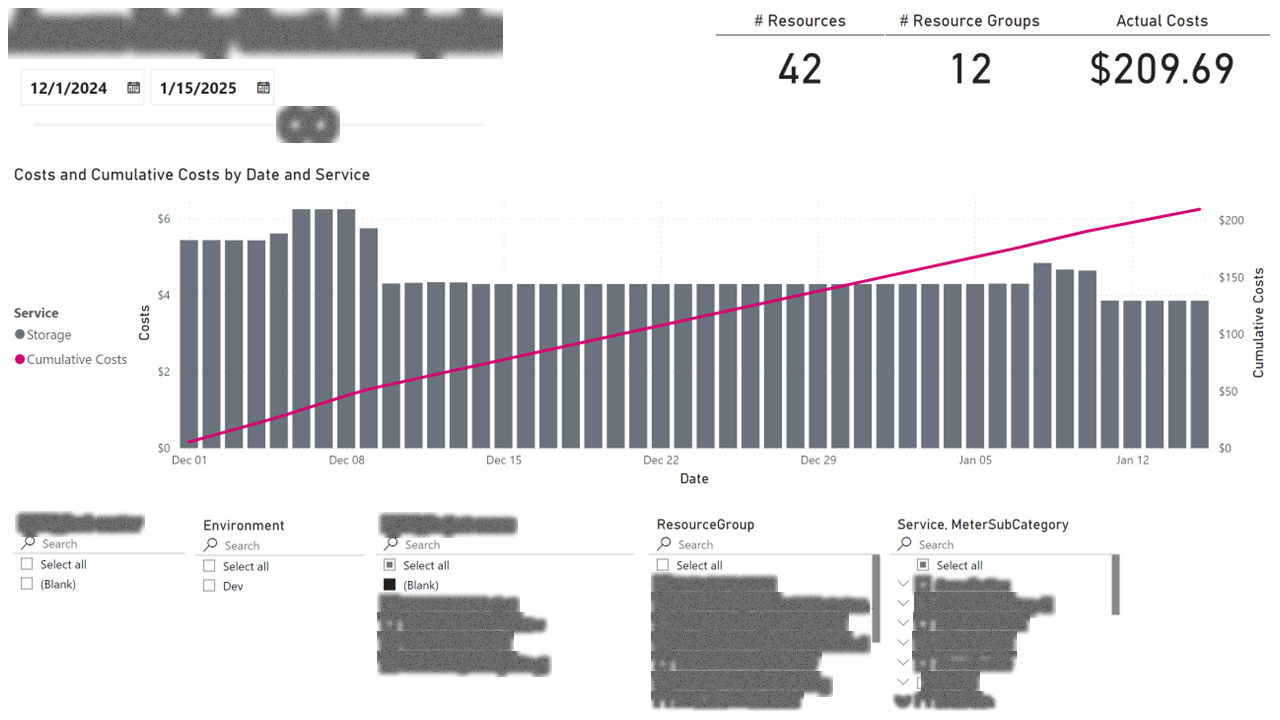
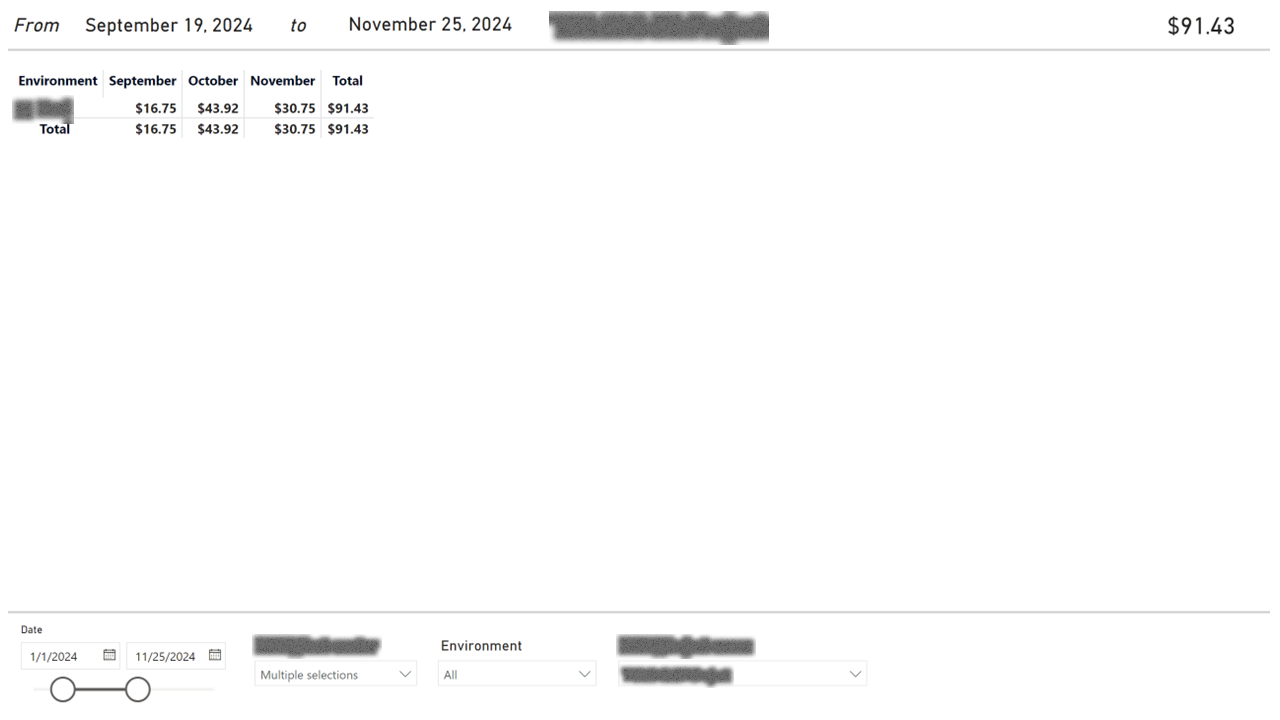
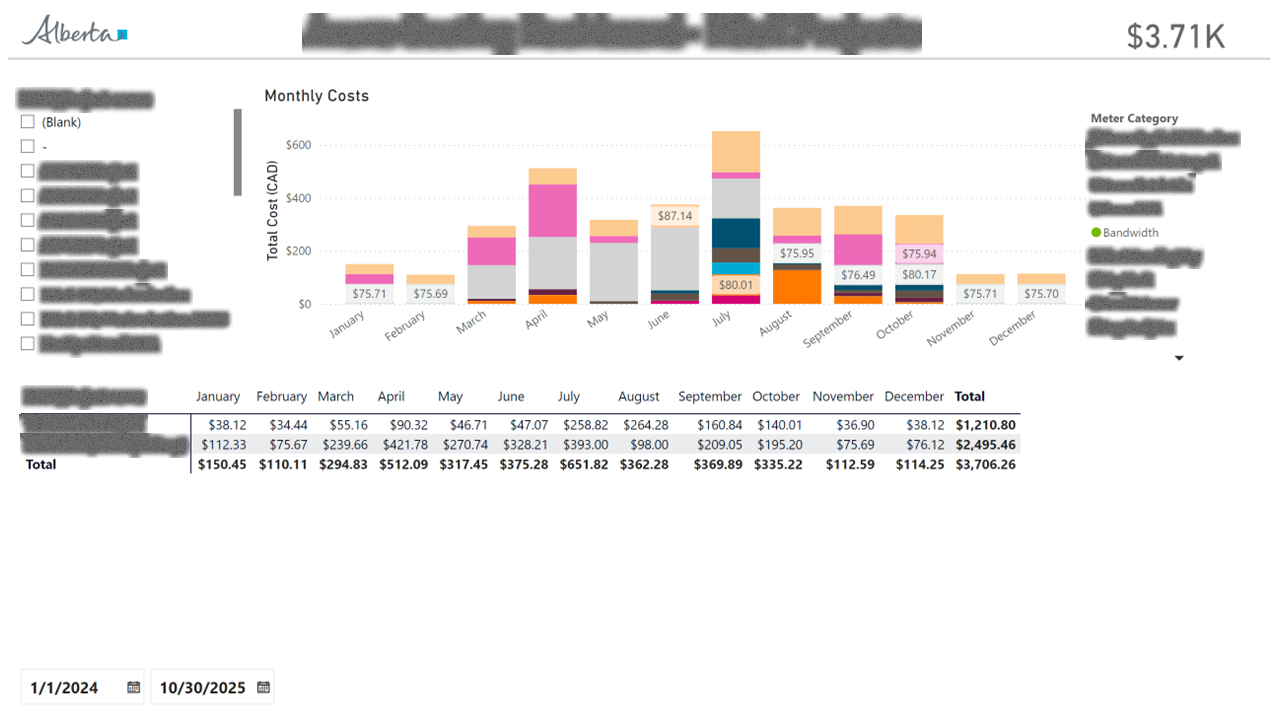
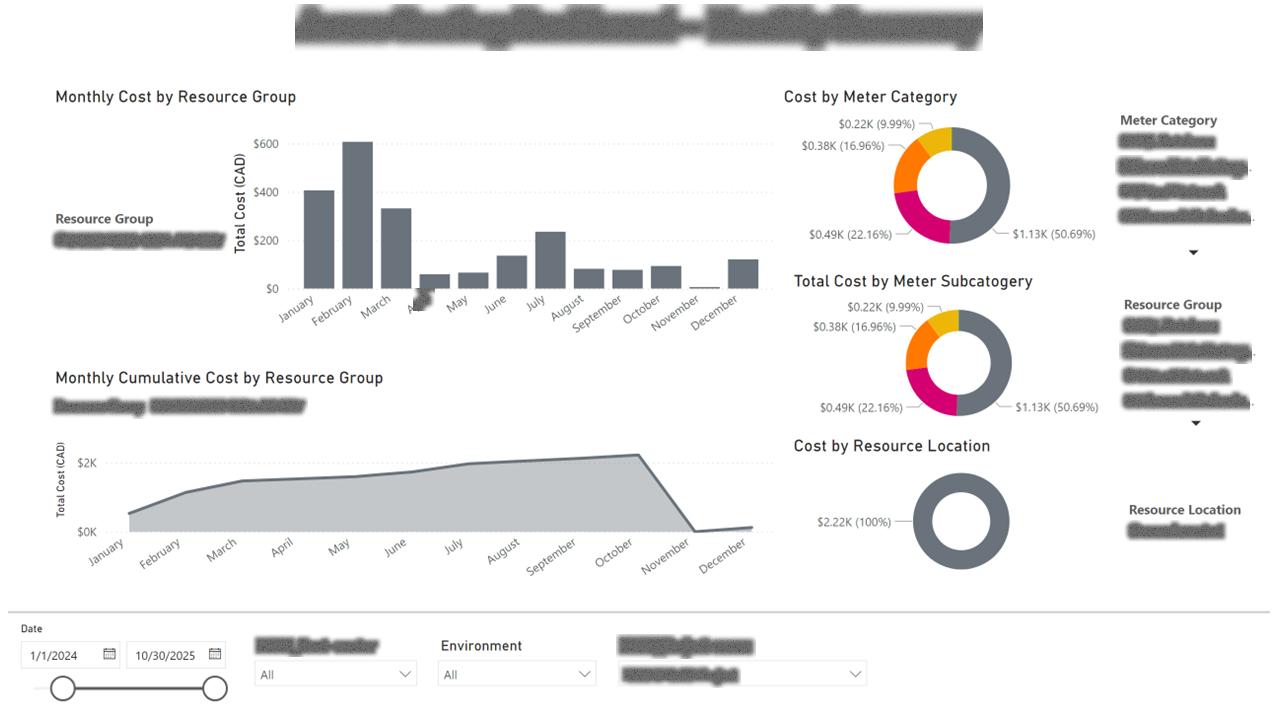
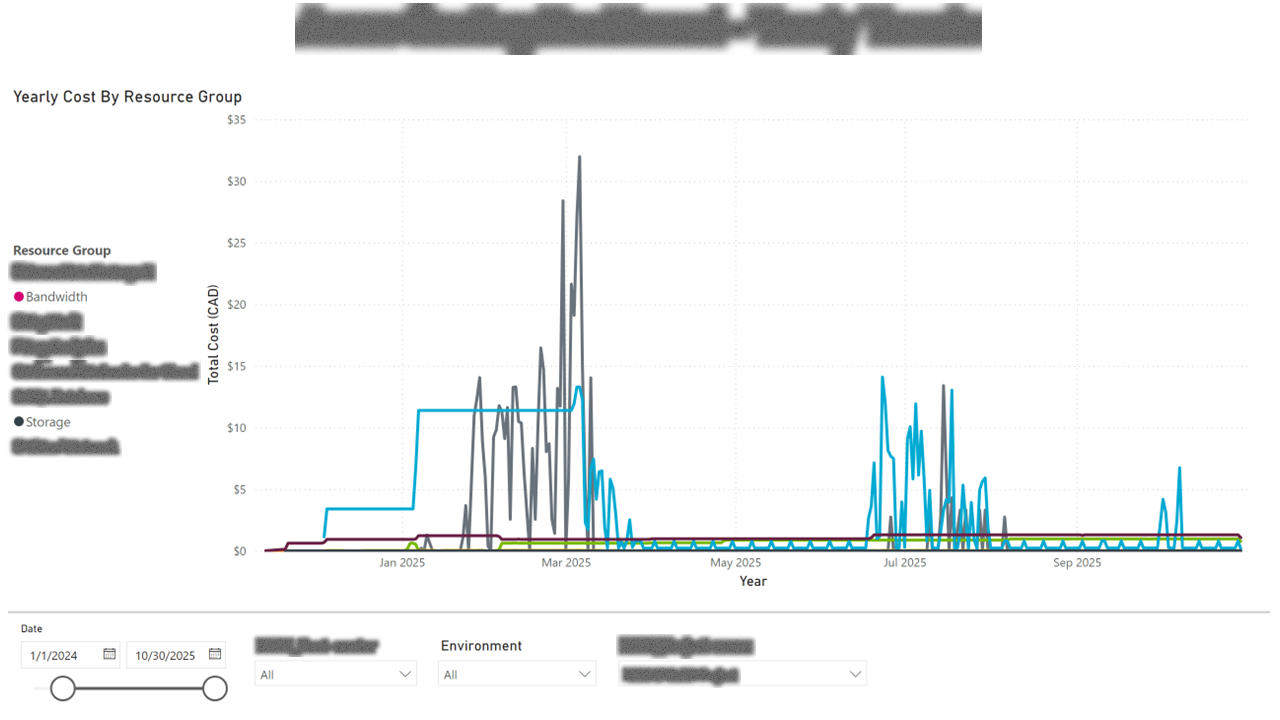
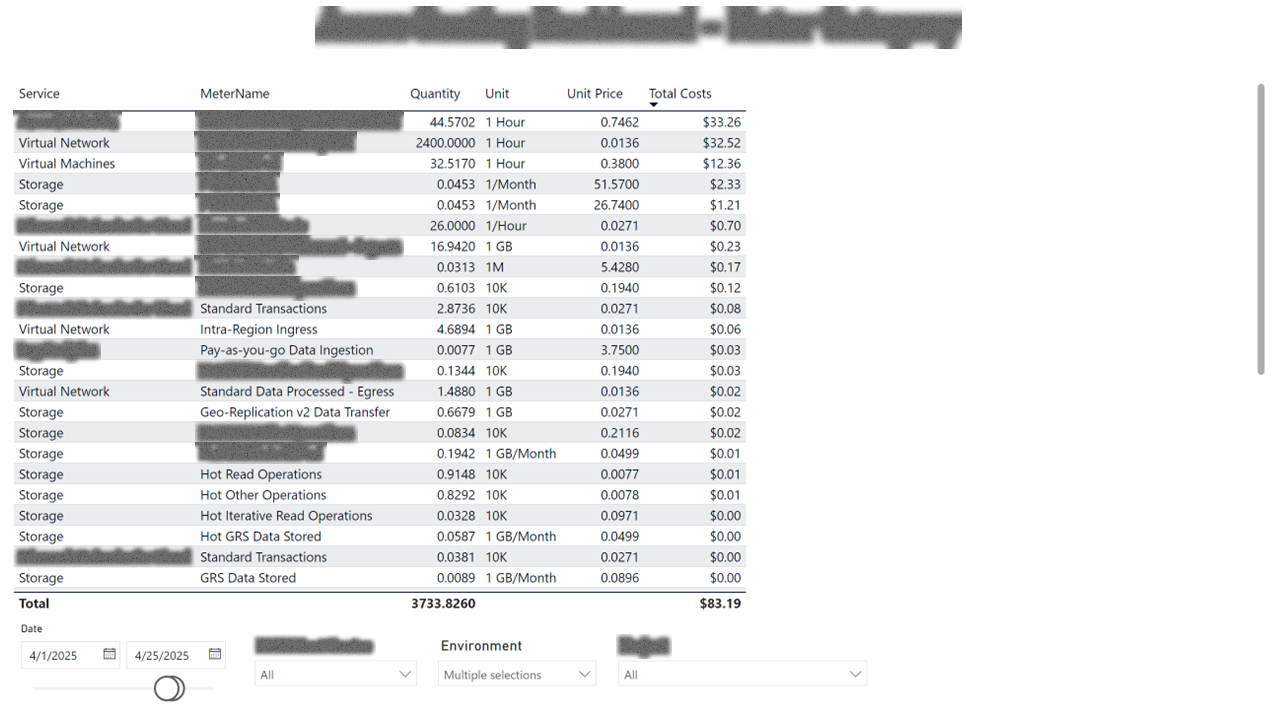
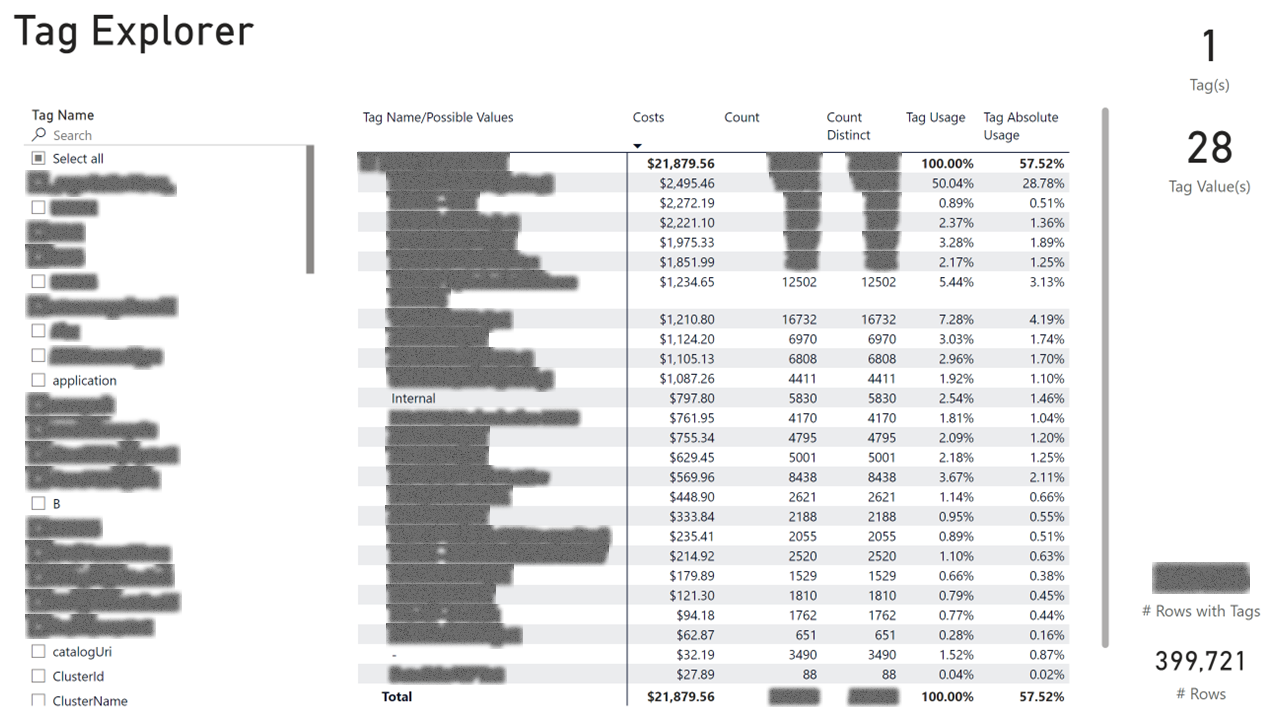
I built a FinOps report that maps every line item to a cost center and project via Azure resource tags, then exposes the data at four levels of granularity: daily, monthly, fiscal-year, and YTD trends. A tag explorer page lets ops leads see what's untagged (and therefore unallocated), and a meter-category page shows which Azure services are driving cost growth versus steady-state.
Outcome
Project owners can now answer "what does my workload cost" and "is my month-over-month change normal" without a meeting. The tag-governance page surfaced a meaningful share of previously unallocated spend, which was the lever that started recovering it back to project budgets.