Challenge
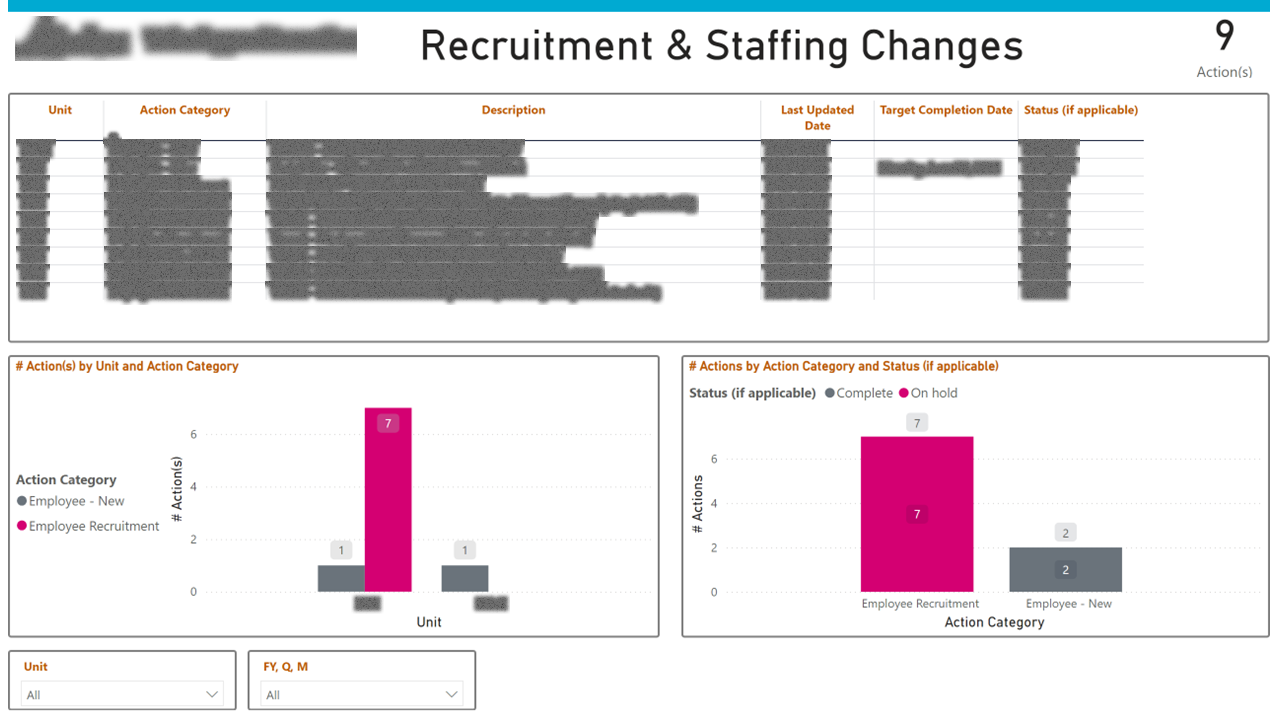
The data function had grown to span recruitment, project delivery, operations, services, and procurement — but reporting on each lived in a different tool, owned by a different lead, refreshed on a different cadence. When executives asked questions like "are we under-resourced for the projects we've committed to," there was no single artifact that could answer it.
Approach
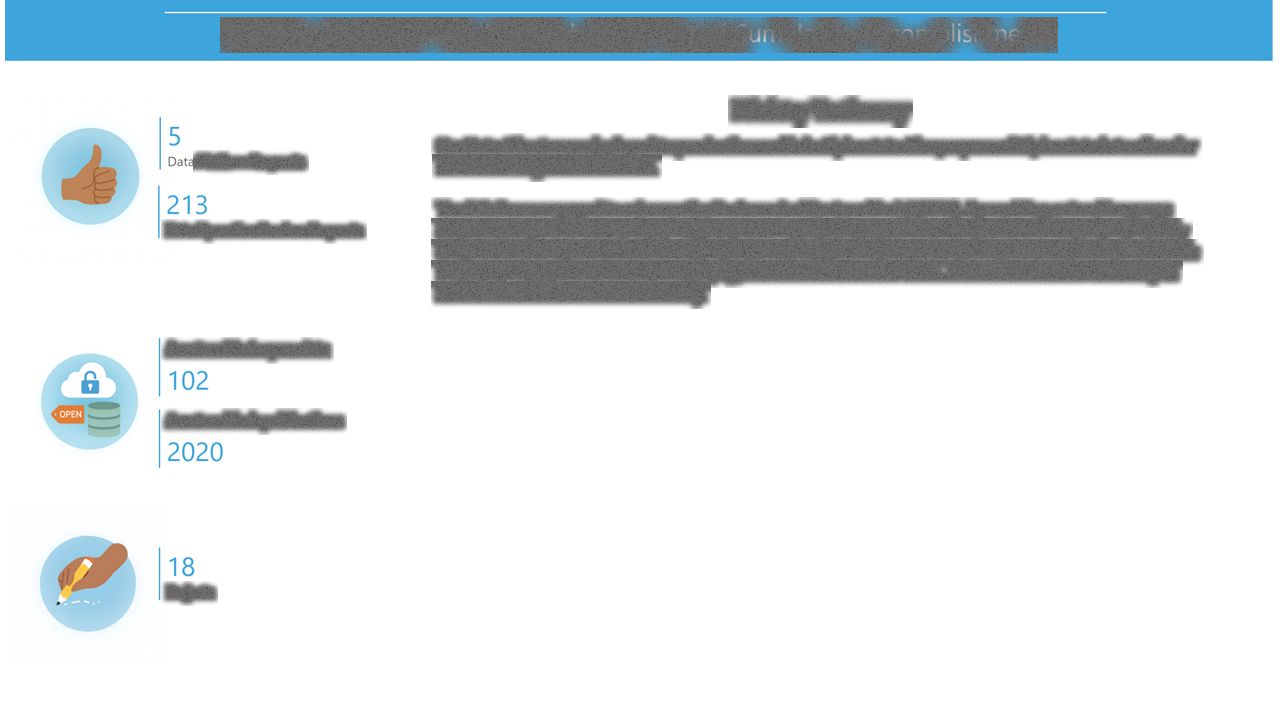
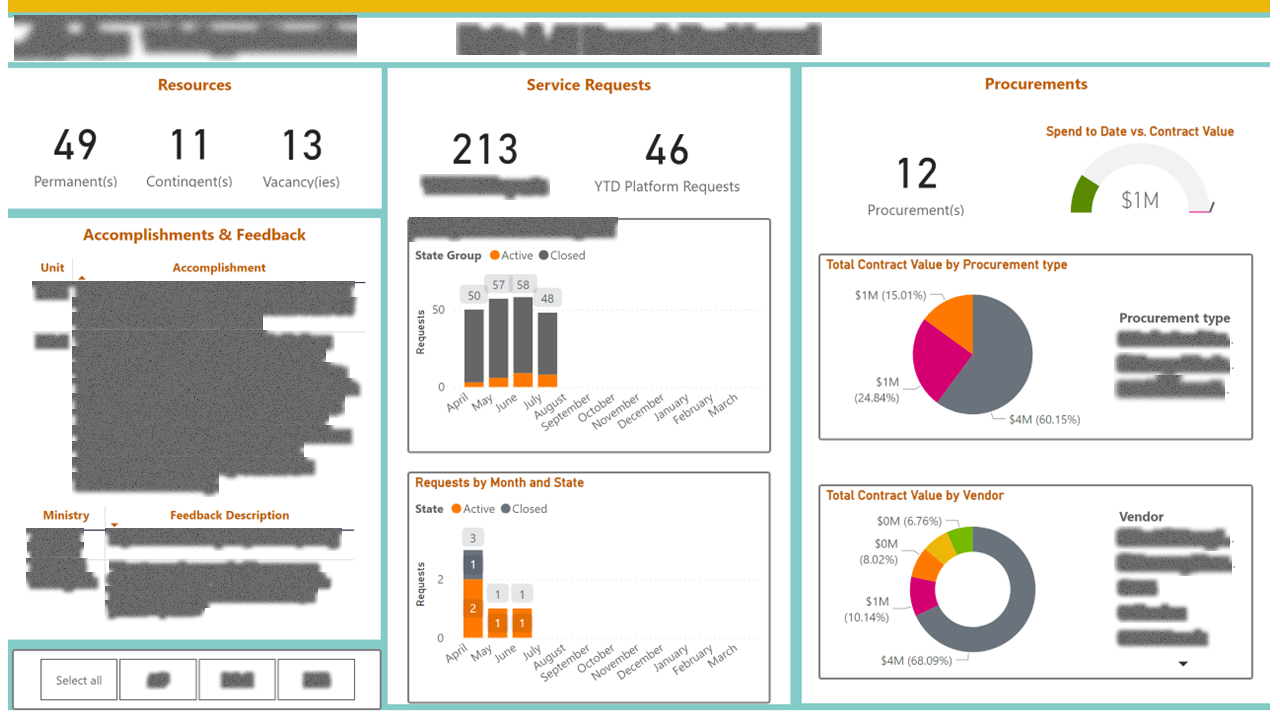
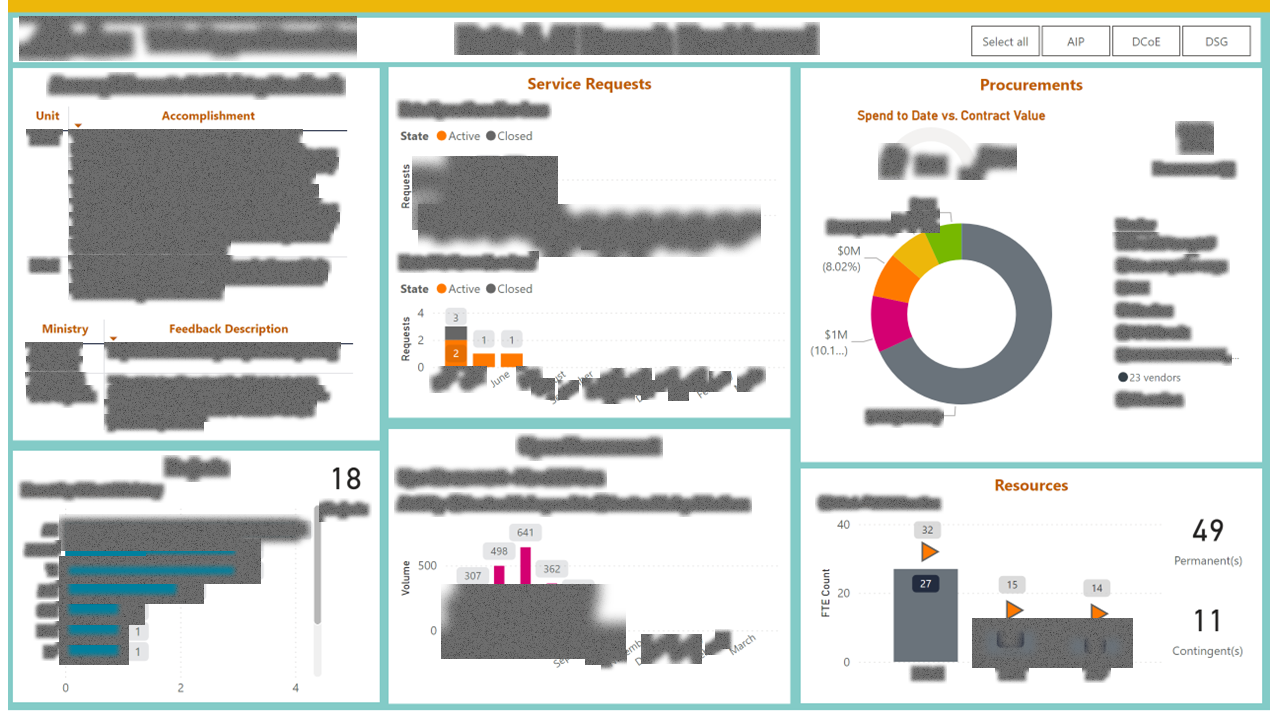
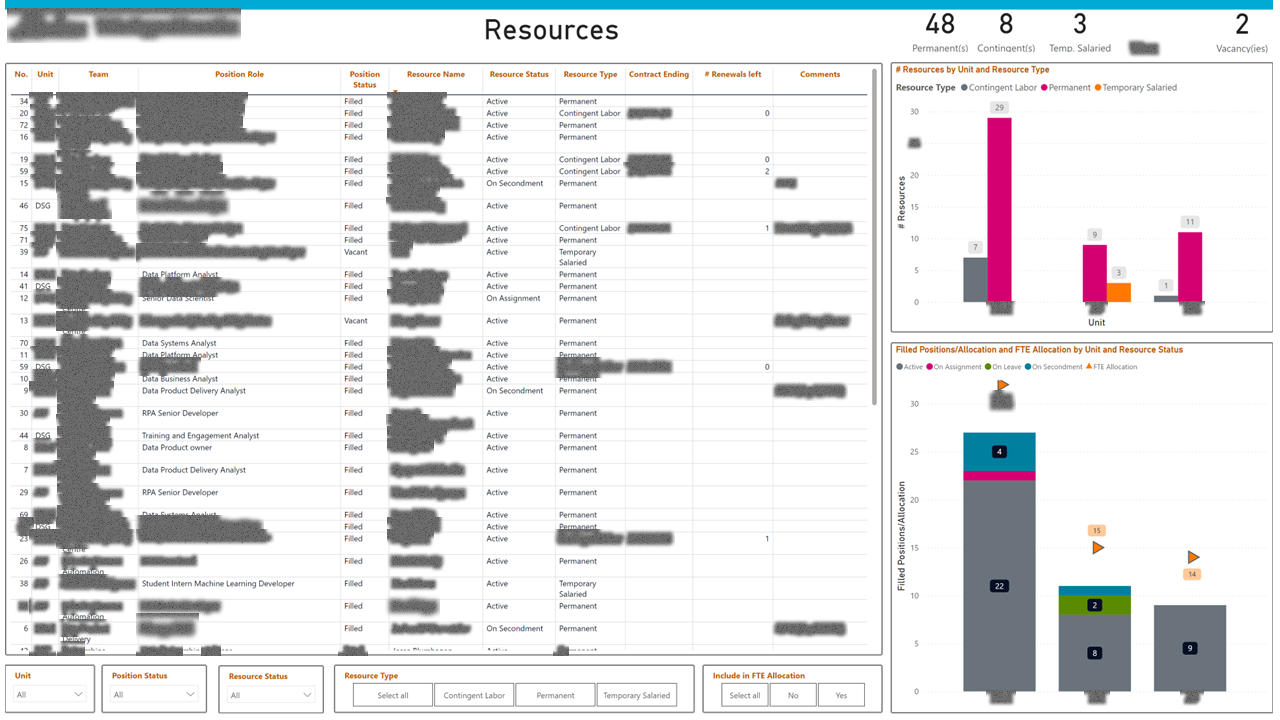
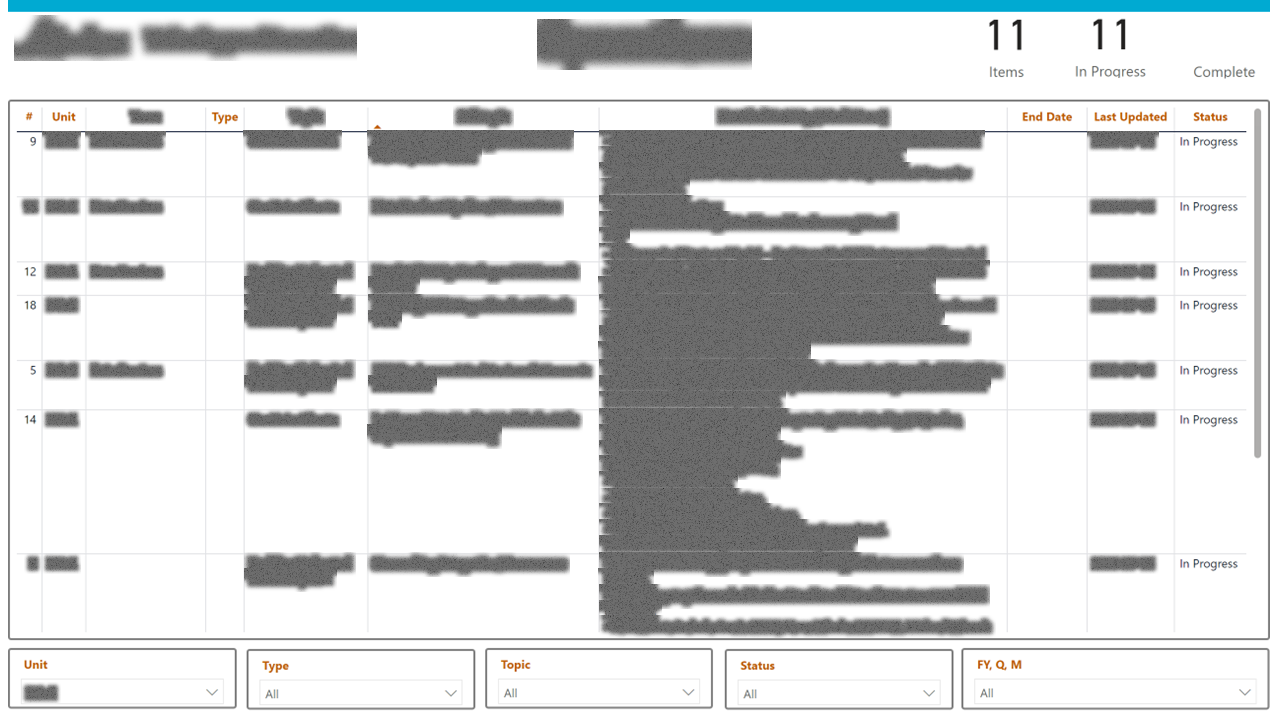
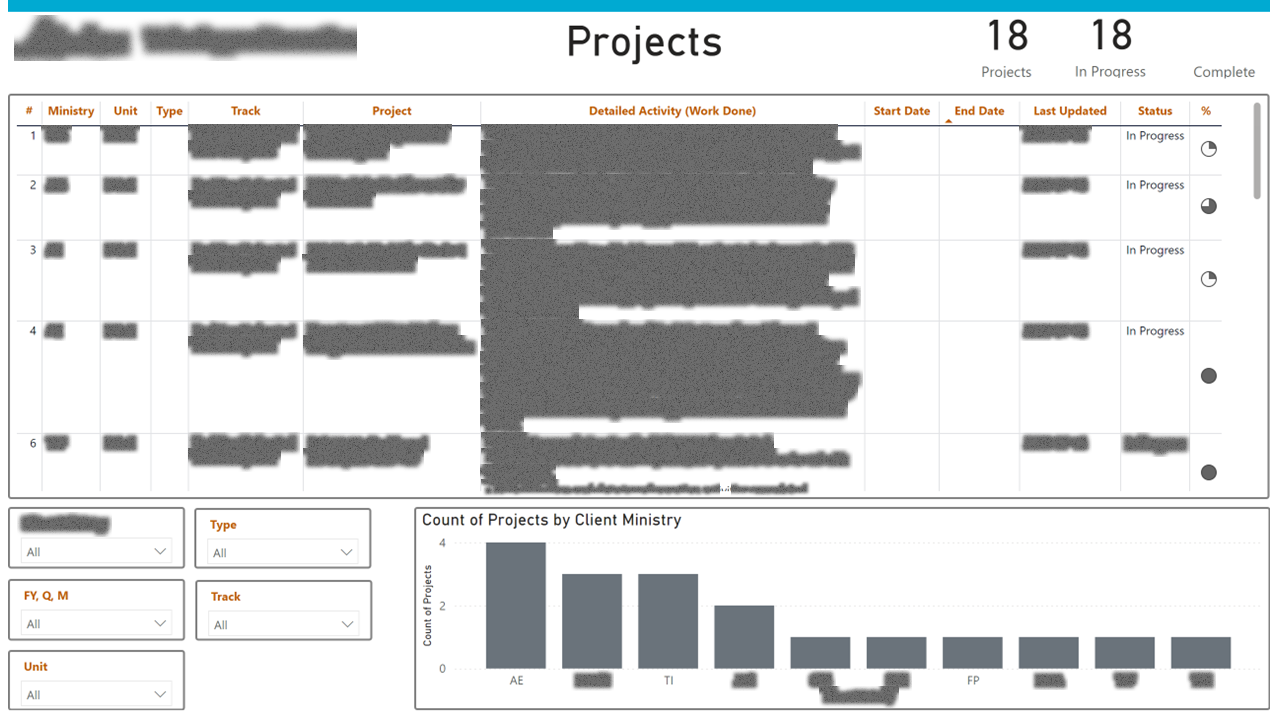
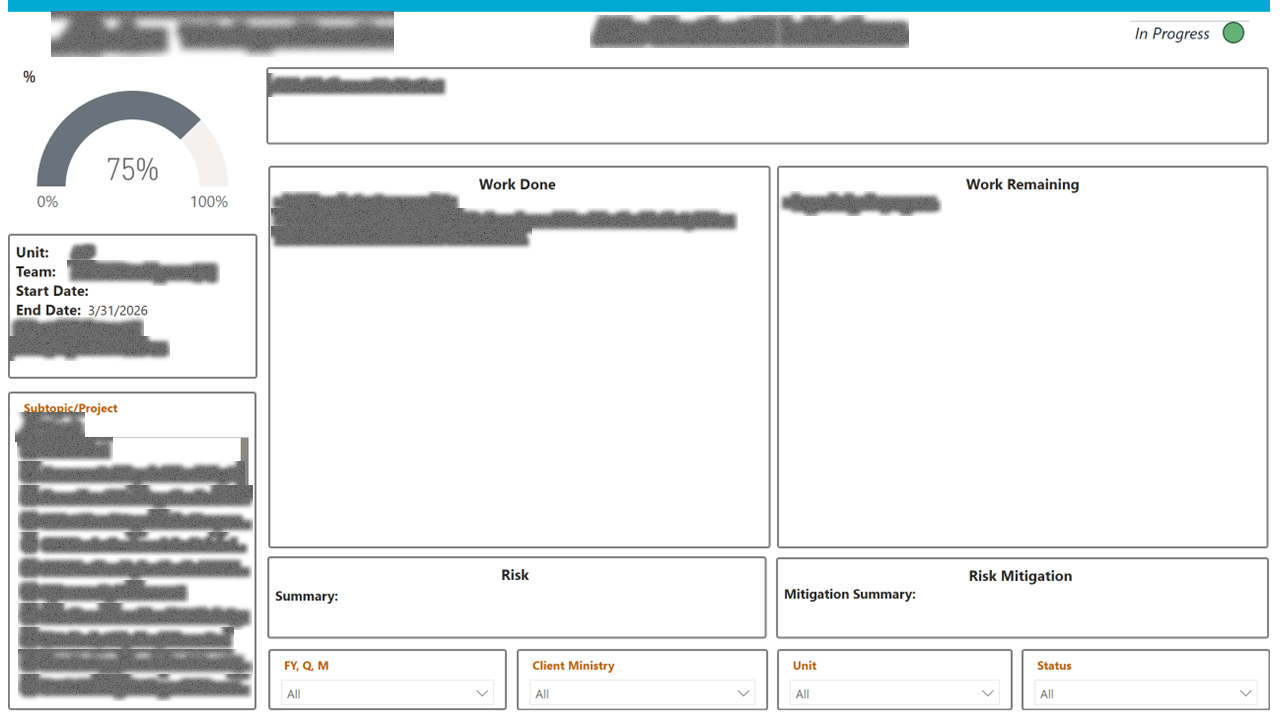
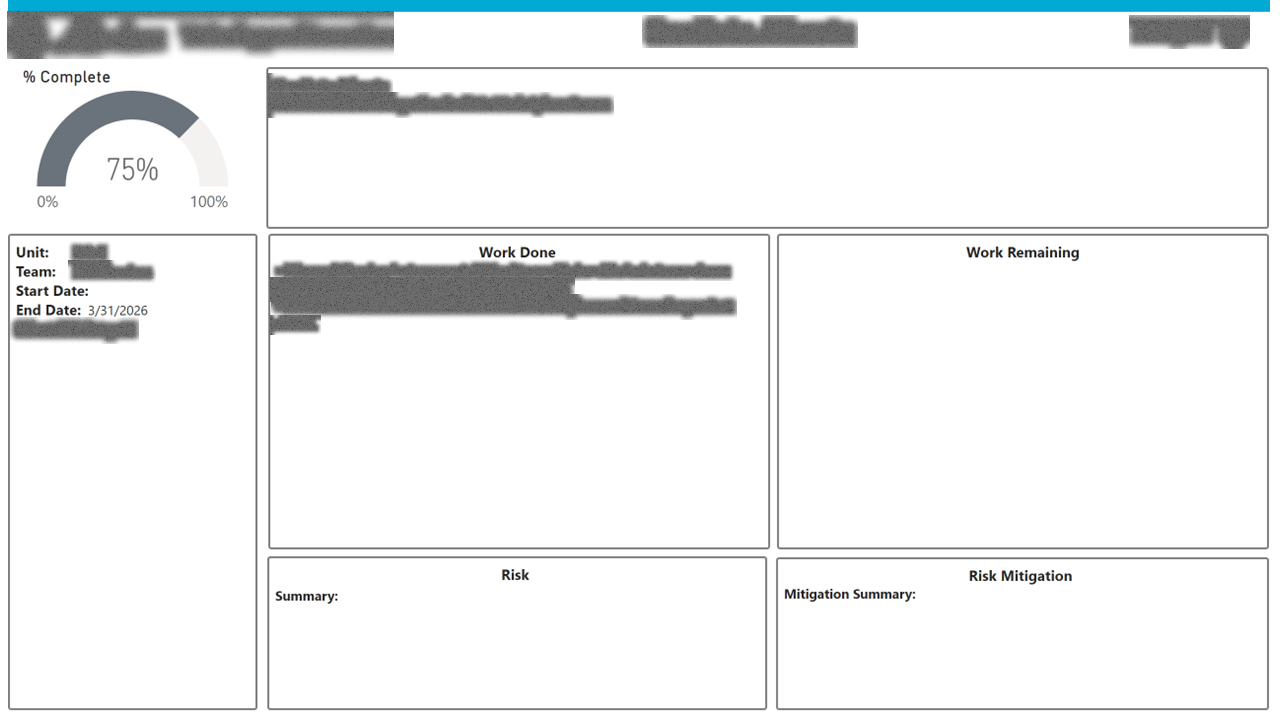
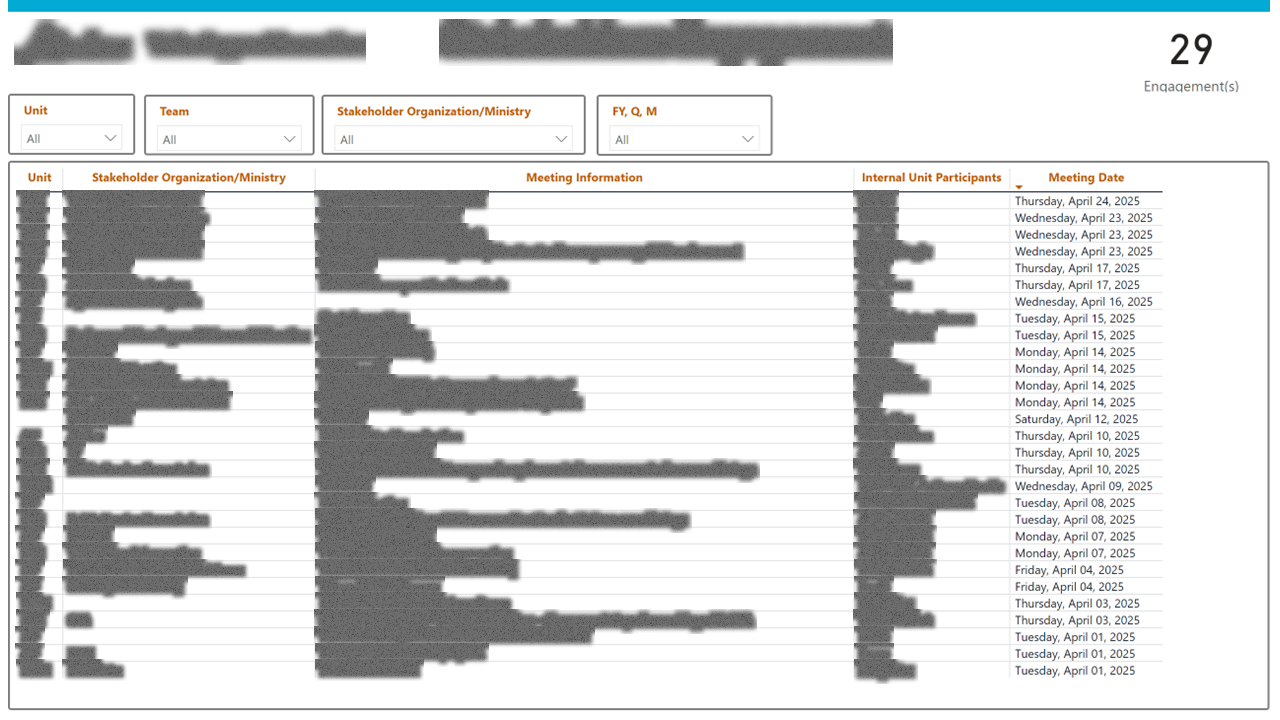
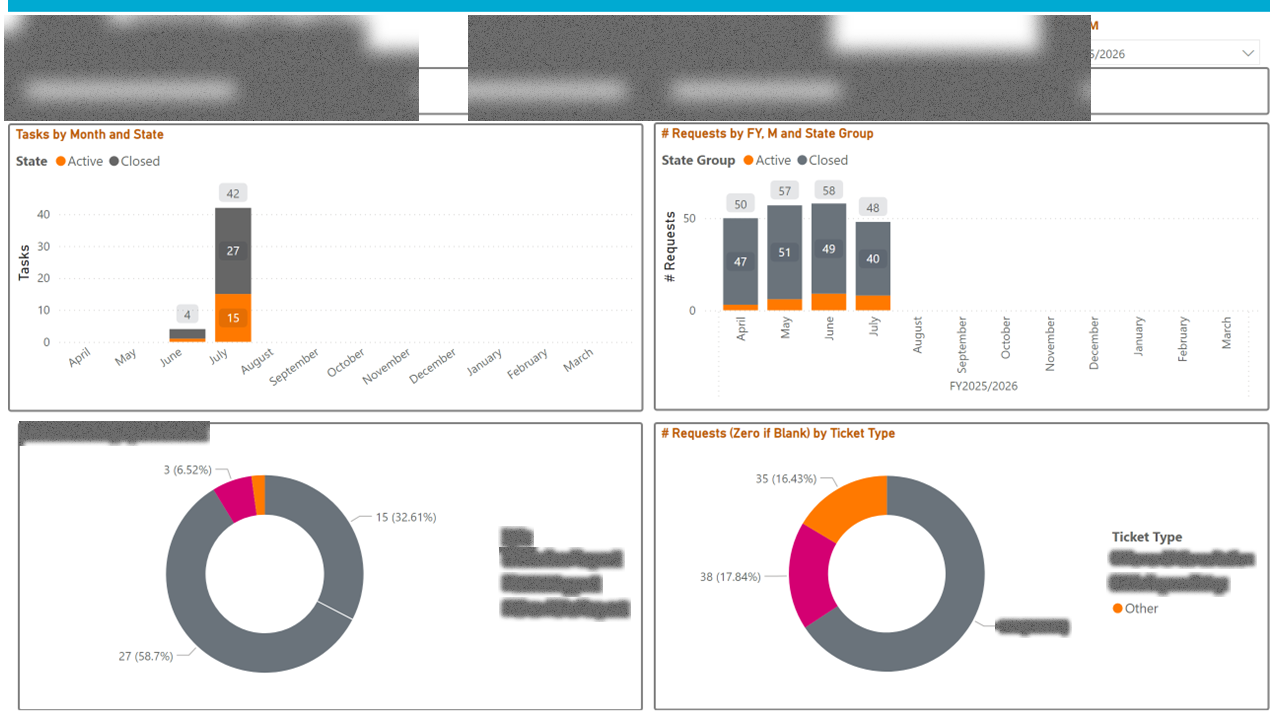
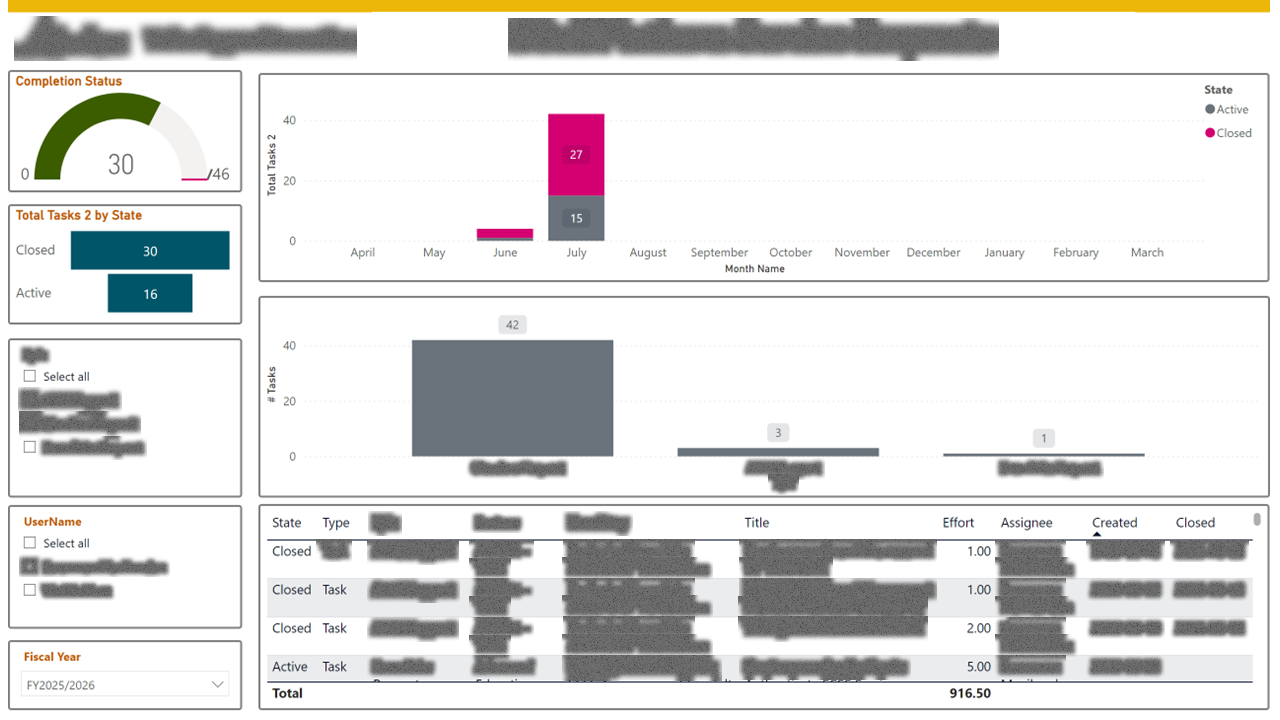
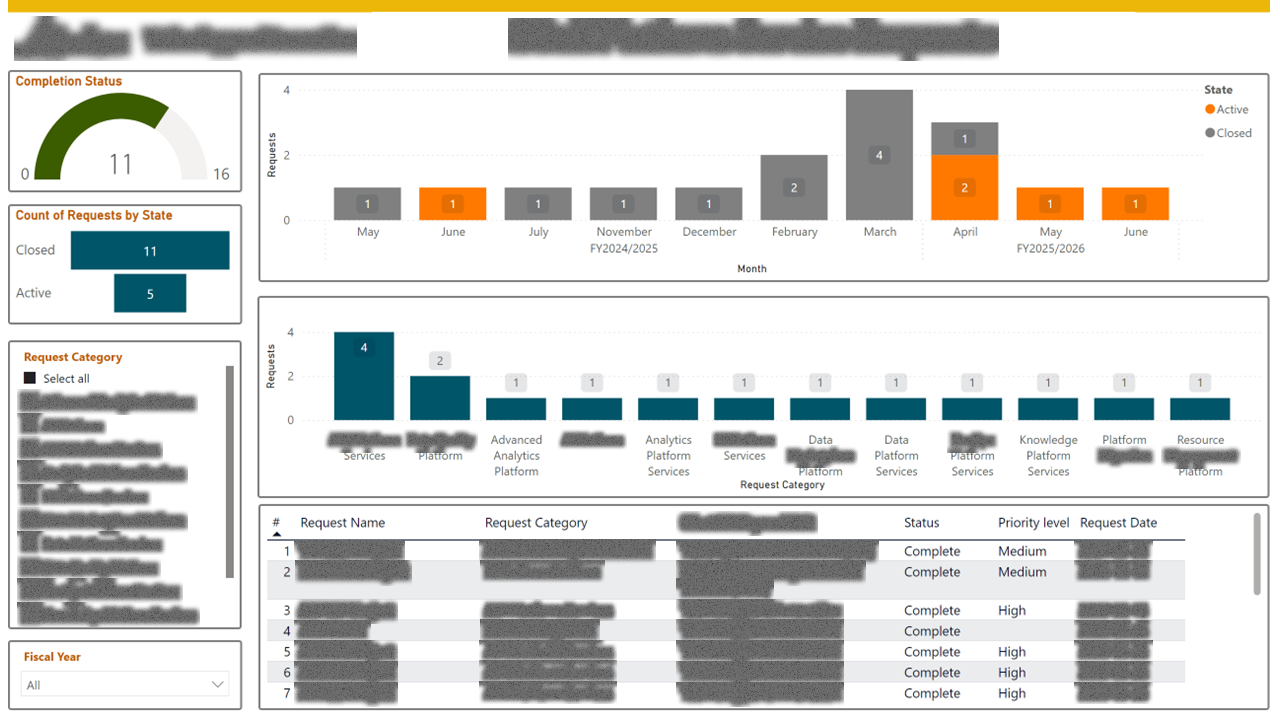
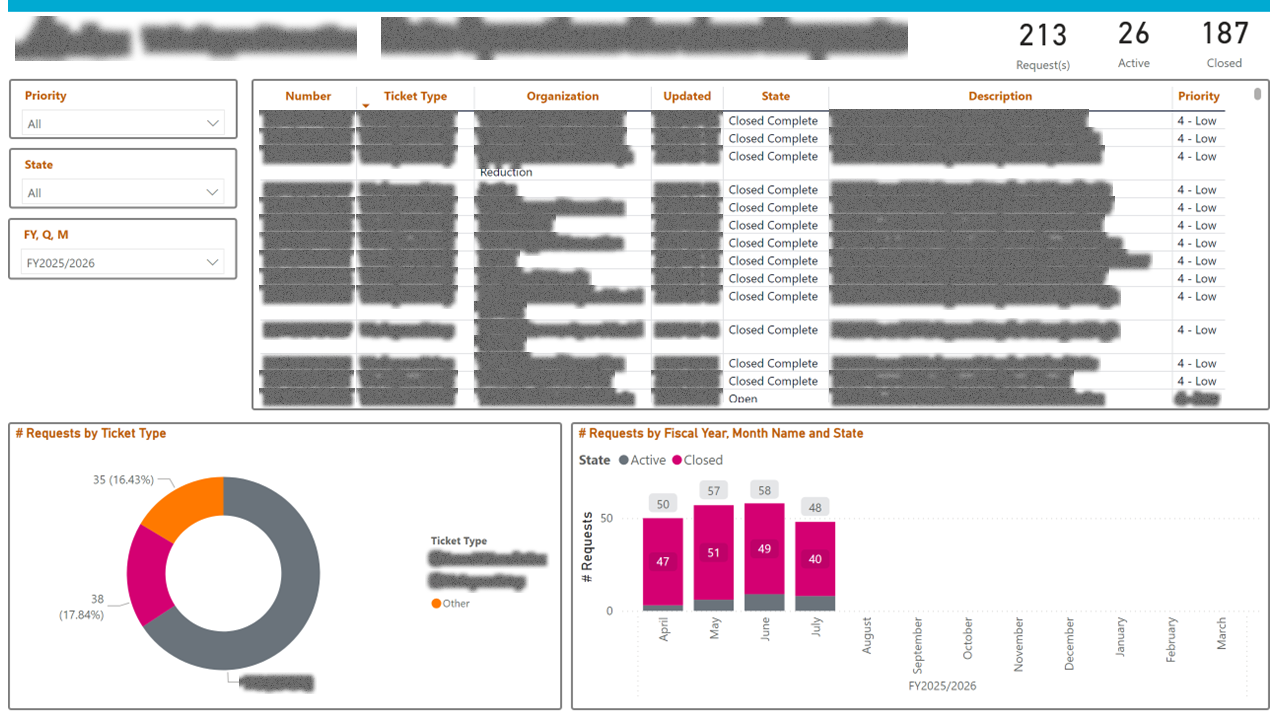
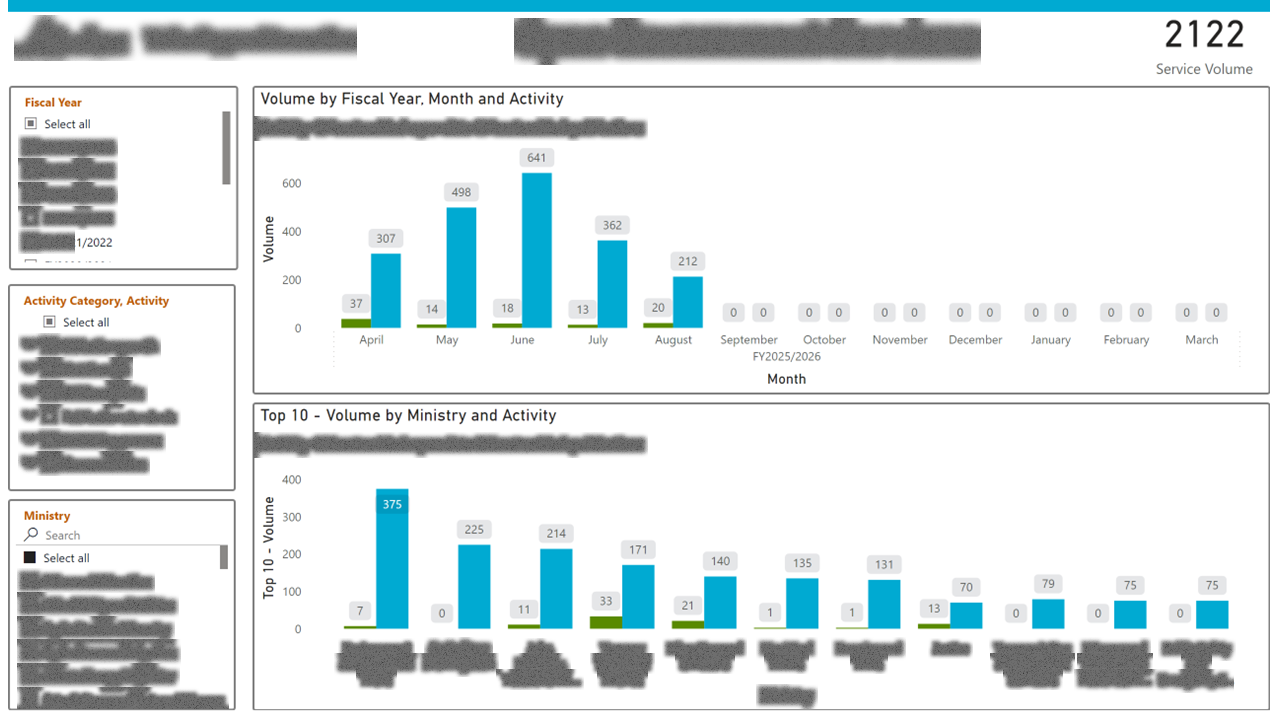
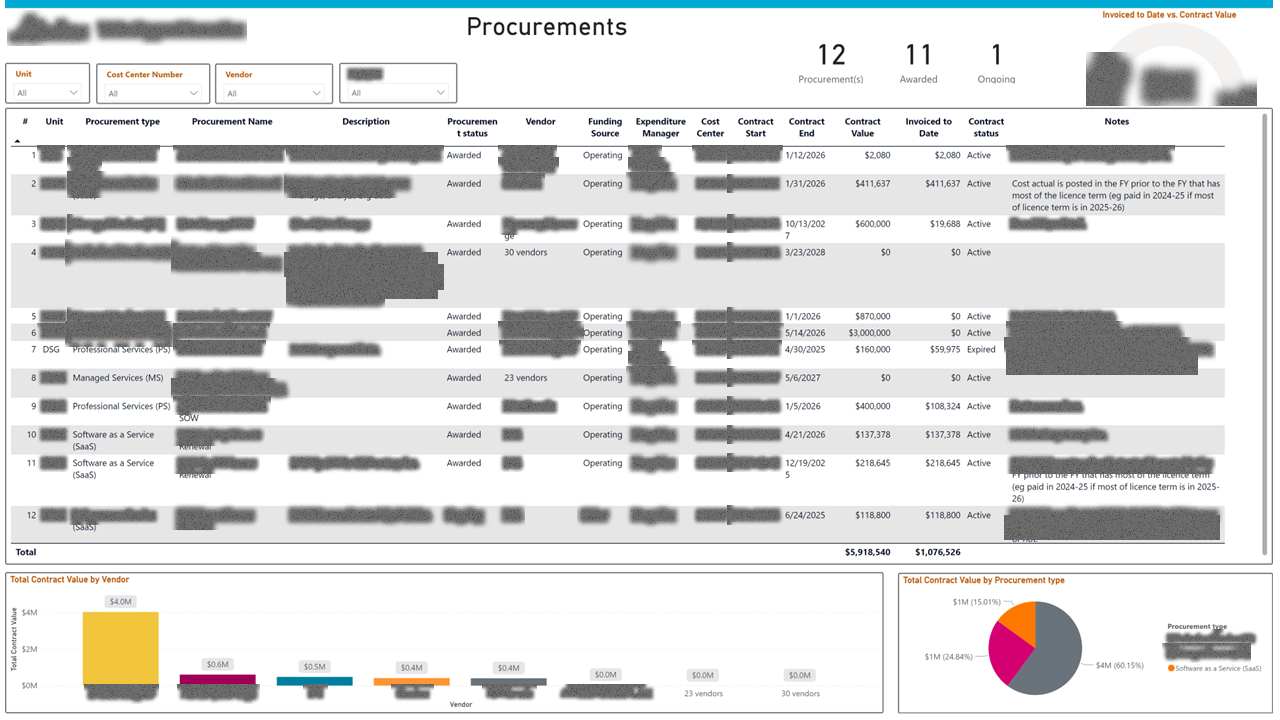
I designed a multi-page report with one page per functional domain (resources, recruitment, operations, projects, services, procurement, stakeholders) and a top-level infographic overview that pulled the most important metric from each. Cross-filtering lets a reader click a project on the operations page and see the headcount, services, and procurement linked to it. Each page is owned by the relevant lead but rolls up automatically into the overview.
Outcome
The suite became the standing operating picture for the function and is used in monthly leadership reviews. It replaced four standalone reports and removed the recurring "send me last month's numbers" email exchange between domain leads.