Challenge
Executive sponsors across the organization had no consistent way to see how the project portfolio was performing. Status was reported through monthly slide decks built by hand, which meant the data was always two to four weeks stale and the format changed every time. By the time leadership saw a red project, it had usually been red for a month.
Approach
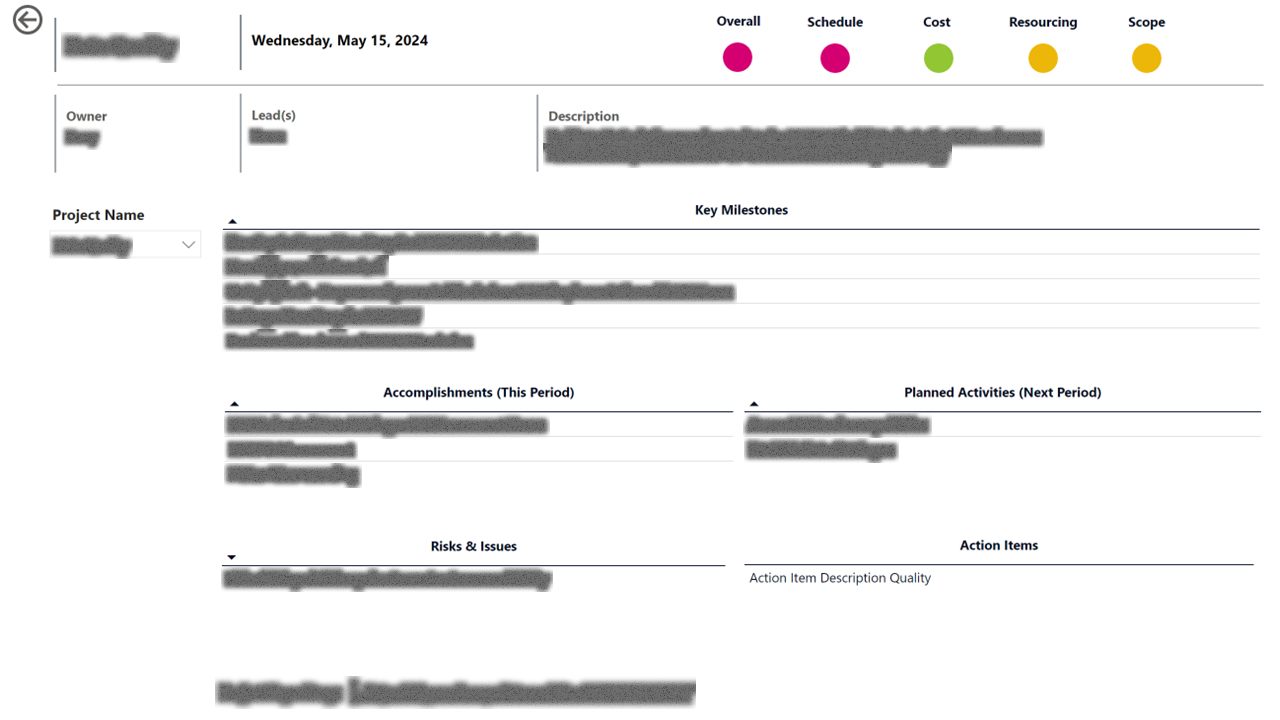
I designed a single-page scorecard that combined the small set of metrics executives actually used — health, owner, milestone status, risk count — and made them refreshable on-demand from the source systems. The cover page lives at the portfolio level, with a drill-through into per-project detail for any owner who wants to dig in. Conditional formatting handles the "where do I look first" question without forcing the reader to scan.
Outcome
The scorecard replaced the manual monthly deck and is now the standing artifact for portfolio reviews. Status conversations shifted from "what does the deck say" to "why is this project red," because the data is already on the table.